

The real estate market is inherently cyclical, with recurring periods of growth, peak, decline, and recovery. For investors, understanding where we are in the cycle—and recognizing key indicators from the past 25 years—can be the difference between maximizing profits and being caught in a downturn.
The Four Phases of the Real Estate Cycle
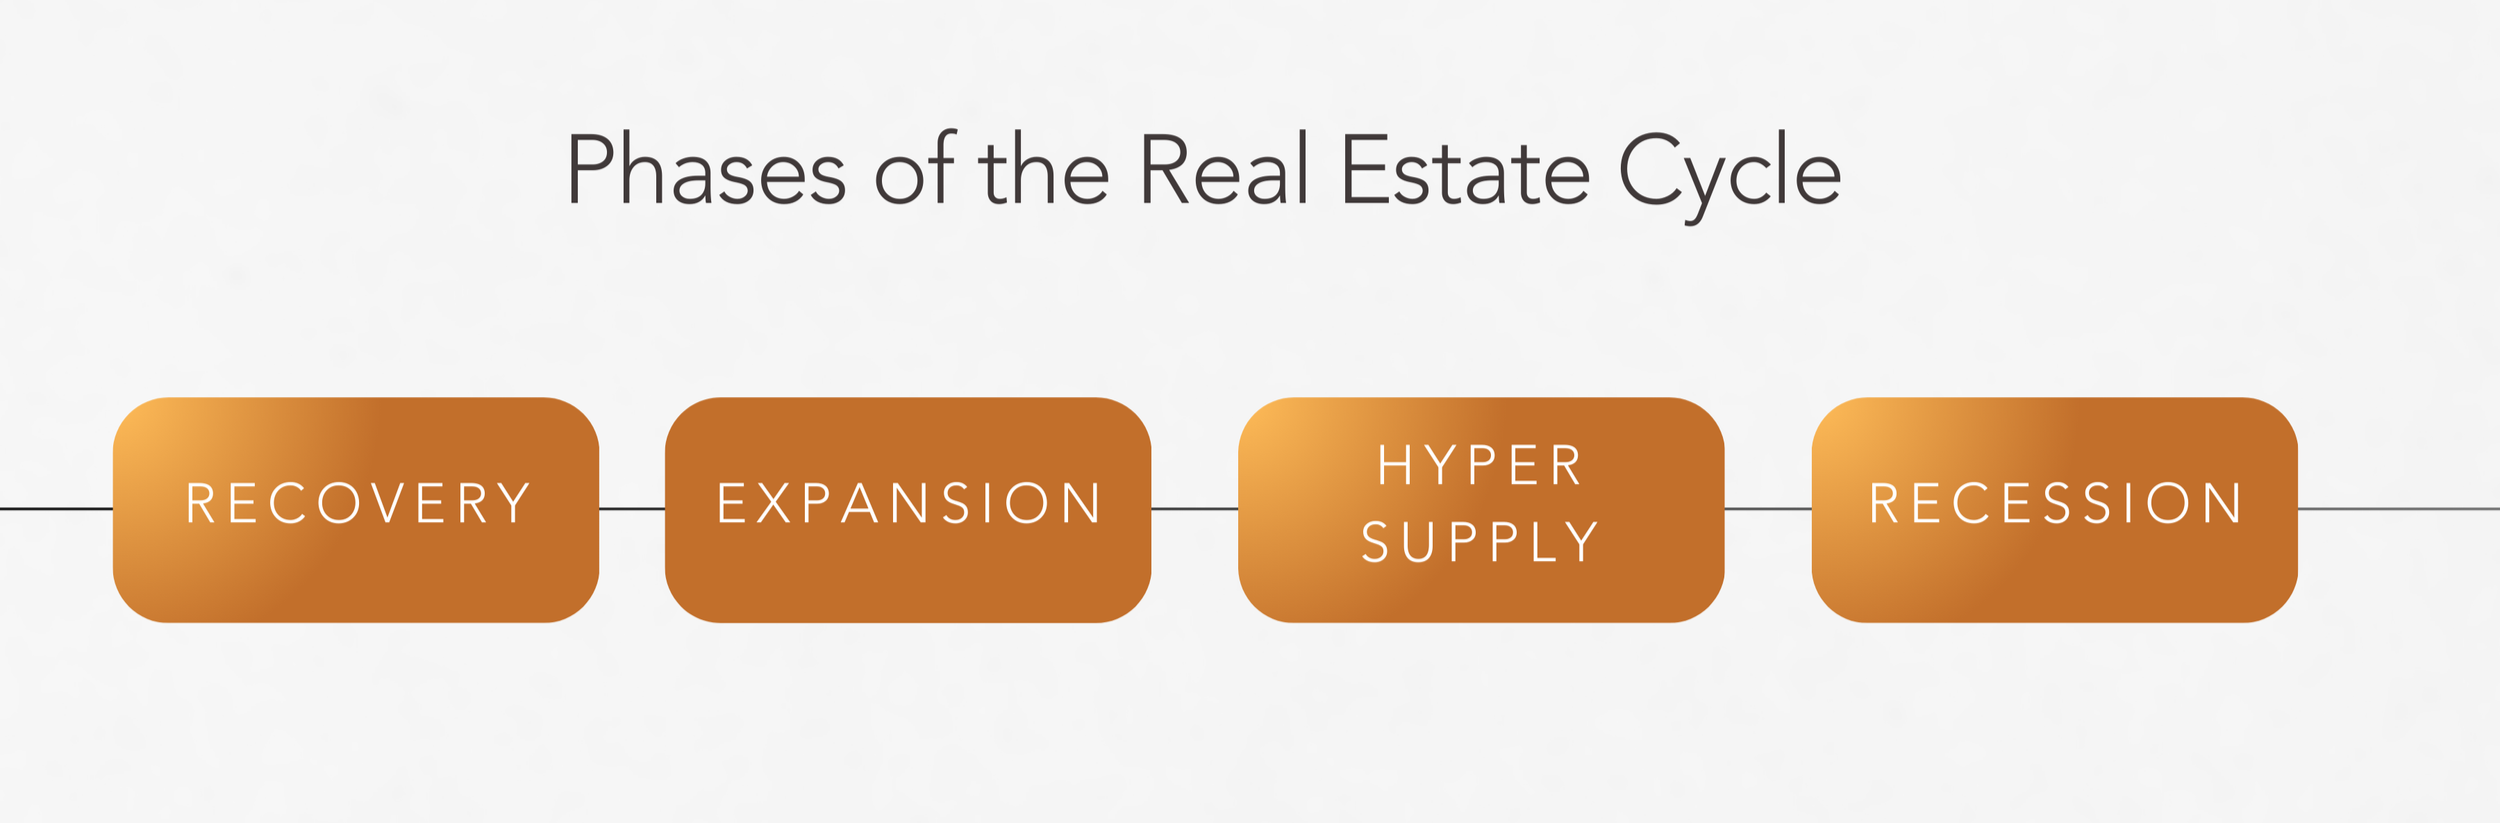
Every real estate cycle follows four key phases:
Recovery | Market starts to rebound after a downturn. Low demand, minimal construction.
Expansion | Demand increases, rents rise, construction activity grows.
Hyper Supply | Inventory surpasses demand, vacancies rise.
Recession | Oversupply leads to declining rents and values, increased vacancies.
Each phase has distinct signals and investment implications.
Real Estate Cycles: A 25-Year Lookback (2000–2025)
2001–2006: Expansion and Bubble Build-up
Low interest rates post-9/11 fueled home buying.
Subprime mortgage lending exploded—40% of mortgages in 2005 were subprime.
National home prices rose 55% between 2001 and 2006 (FHFA Index).
Major metros like Phoenix, Las Vegas, and Miami saw appreciation over 80%.
Investor Takeaway: Easy credit and high demand can overinflate prices. Watch lending standards and mortgage approval rates.
2007–2011: Recession and Crash
2007: Housing starts declined 26% YoY; early sign of recession.
2008: Global financial crisis; Lehman Brothers collapsed.
Home prices dropped 27% nationally from peak (Case-Shiller Index).
Foreclosures peaked at 2.9 million in 2010 (RealtyTrac).
What to Watch:
Spike in days on market and rising inventory levels.
Cap rate decompression—values drop as NOI stagnates but investor risk increases.
Bank tightening credit—mortgage availability index dropped from 869 in 2006 to 100 in 2009 (MBA).
2012–2019: Recovery and Long Expansion
Record-low interest rates fueled investor activity.
National median home prices recovered and exceeded pre-crash highs by 2016.
Rental demand surged, with homeownership dropping from 69% (2006) to 63% (2016).
Multifamily construction rebounded; completions doubled from 168,000 units in 2011 to 364,000 in 2018 (Census Bureau).
Key Indicators:
Rising rents and occupancy signal expansion.
Cap rates compressed—from 8.1% in 2010 to 5.2% in 2019 (NAR).
Strong job growth and urban migration trends accelerated demand.
2020–2022: Pandemic Disruption and Rapid Expansion
COVID-19 crash and Fed intervention drove rates to 2.65% (Jan 2021).
Massive housing demand shift: suburbs, remote work, and low inventory.
Home prices skyrocketed: +40% between 2020 and 2022 (Zillow).
Construction costs increased 30-40%, causing delays and affordability issues.
Investment Trends:
Investors pivoted to Build-to-Rent (BTR) models.
Migration data became critical (e.g., U-Haul & USPS change of address trends).
Inflation hedge strategies emerged—real estate viewed as protection.
2023–2025: Transition & Uncertainty
Interest rates surged to 7%+ (Fed combatting inflation).
Affordability crisis: Homebuyers needed $115,000+ income to afford median home (NAR, 2024).
Commercial real estate hit harder: Office vacancies reached record highs (CoStar: >20% in many metros).
Rental growth slowed, especially in multifamily. Some Sun Belt markets saw YoY rent declines in 2024 (Zumper).
Current Trends to Watch:
Cap rate expansion as interest rates rise—property values fall unless rents grow.
Loan maturities—watch for distressed sales and refinancing challenges.
Construction pipeline delays—supply-side shortages in some markets create opportunity.
Job markets in tech-heavy cities (like Austin, San Francisco) are bellwethers.
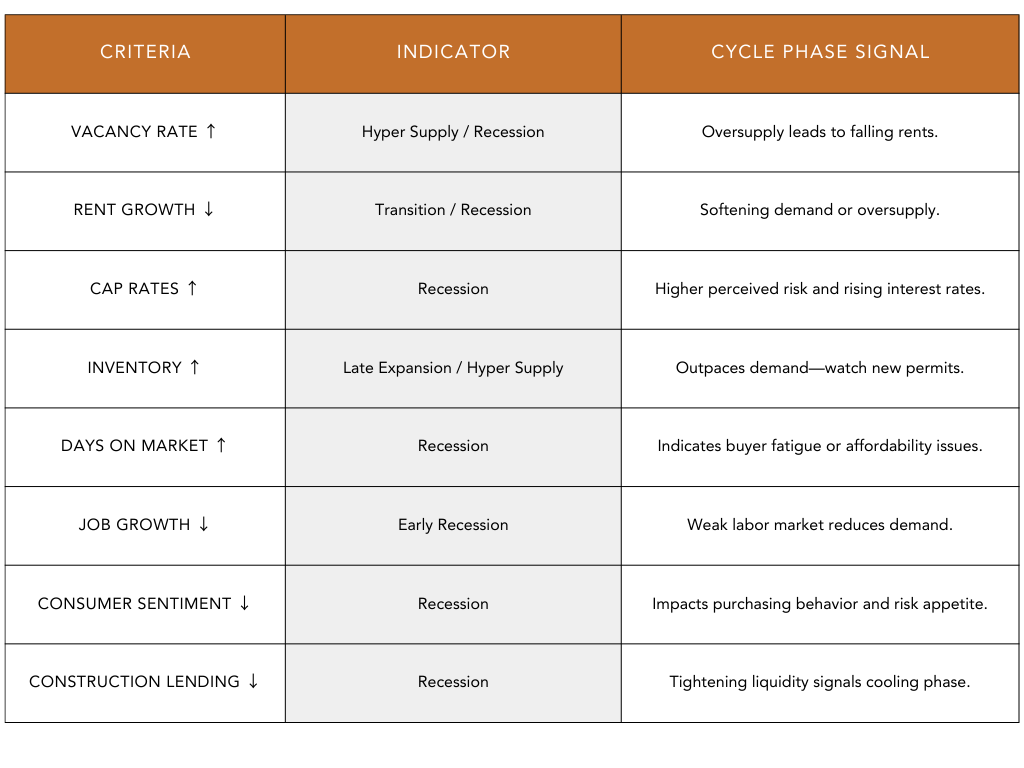
Key Metrics and Signals for Investors
Lessons and Strategic Takeaways
Cycle Timing Is Crucial
Buy in late recession or early recovery.
Sell or refinance during peak expansion.
Watch the Fed and Mortgage Rates
Monetary policy leads real estate by 6–18 months.
Rising rates → falling demand → price adjustments.
Leverage During Recovery; Deleverage in Expansion
Use leverage when prices are low and cash flow is strong.
Reduce debt before interest rate hikes.
Track Local Market Cycles
Real estate is hyper-local. Boise ≠ San Francisco ≠ Miami.
Use job data, permit volume, and population trends.
Diversify Across Asset Classes and Geographies
Office, industrial, multifamily, and retail move on different timelines.
Mix urban core and emerging suburbs.
Where Are We Now in 2025?
In mid-2025, we appear to be in the late correction or early recovery phase for certain asset types (multifamily, office), while industrial and select retail assets remain stable or growing. Residential housing is experiencing a stalled market due to high interest rates and affordability limits, but constrained inventory is propping up prices.
Smart investors are watching for distressed deals, carefully analyzing debt exposure, and positioning for the next wave of opportunity—likely to begin in 2026 as interest rates gradually fall.